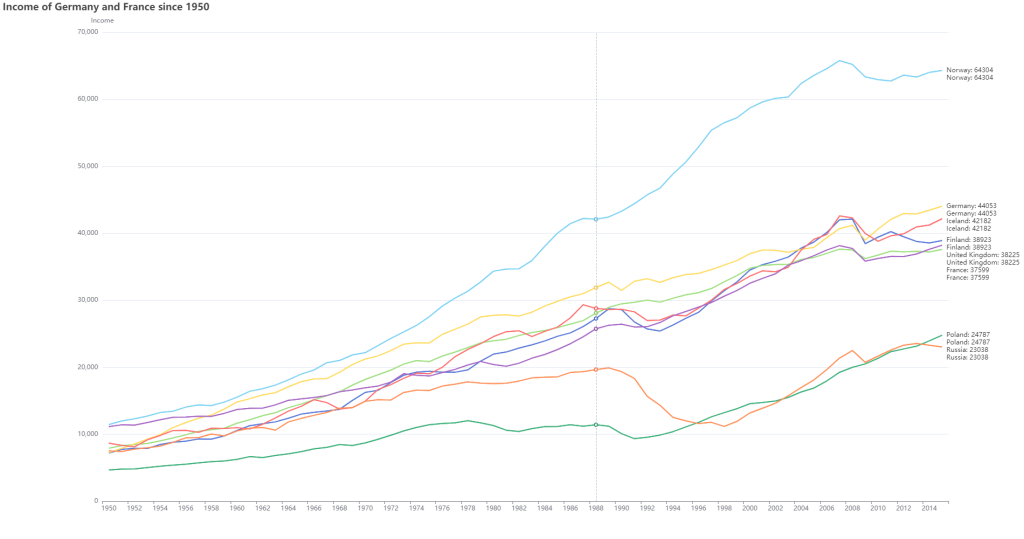
import React, {Component} from 'react';
import ReactECharts from 'echarts-for-react';  // or var ReactECharts = require('echarts-for-react');


interface AppProps {}
interface AppState {}


export default class EChartApp extends Component<AppProps, AppState> {

    constructor(props:any) {
        super(props);
        this.state = {
            name: "Charts React"
        };
    }
    option = {
        legend: {},
        tooltip: {
            trigger: 'axis',
            showContent: false
        },
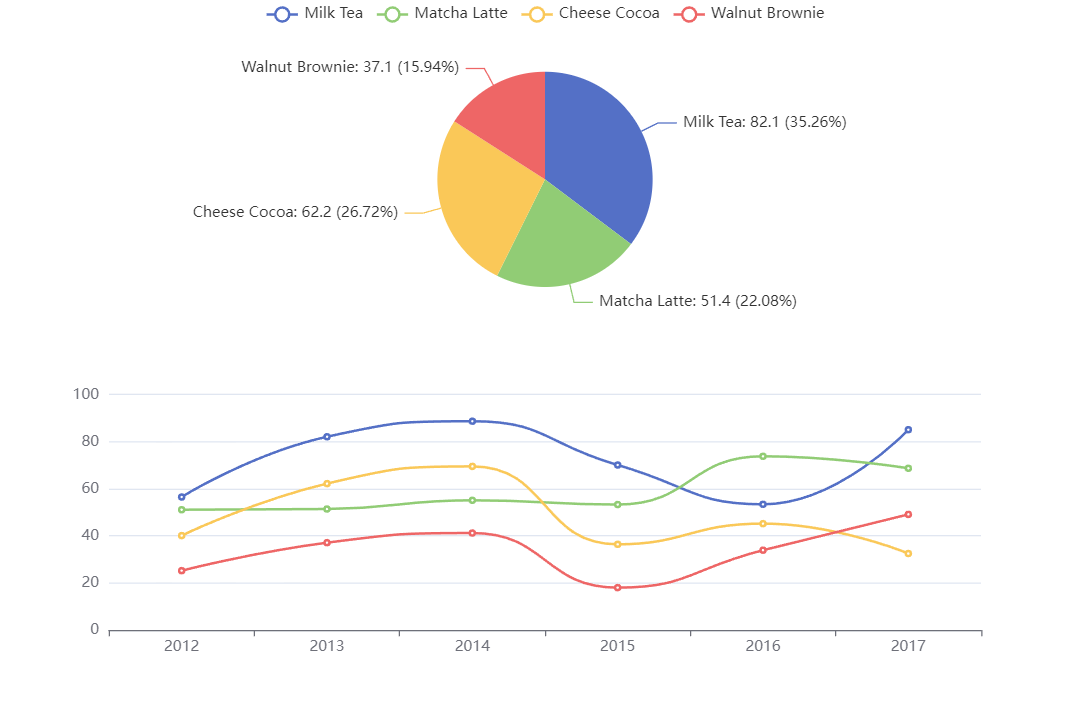
        dataset: {
            source: [
                ['product', '2012', '2013', '2014', '2015', '2016', '2017'],
                ['Milk Tea', 56.5, 82.1, 88.7, 70.1, 53.4, 85.1],
                ['Matcha Latte', 51.1, 51.4, 55.1, 53.3, 73.8, 68.7],
                ['Cheese Cocoa', 40.1, 62.2, 69.5, 36.4, 45.2, 32.5],
                ['Walnut Brownie', 25.2, 37.1, 41.2, 18, 33.9, 49.1]
            ]
        },
        xAxis: { type: 'category' },
        yAxis: { gridIndex: 0 },
        grid: { top: '55%' },
        series: [
            {
                type: 'line',
                smooth: true,
                seriesLayoutBy: 'row',
                emphasis: { focus: 'series' }
            },
            {
                type: 'line',
                smooth: true,
                seriesLayoutBy: 'row',
                emphasis: { focus: 'series' }
            },
            {
                type: 'line',
                smooth: true,
                seriesLayoutBy: 'row',
                emphasis: { focus: 'series' }
            },
            {
                type: 'line',
                smooth: true,
                seriesLayoutBy: 'row',
                emphasis: { focus: 'series' }
            },
            {
                type: 'pie',
                id: 'pie',
                radius: '30%',
                center: ['50%', '25%'],
                emphasis: {
                    focus: 'self'
                },
                label: {
                    formatter: '{b}: {@2012} ({d}%)'
                },
                encode: {
                    itemName: 'product',
                    value: '2012',
                    tooltip: '2012'
                }
            }
        ]
    }
    render() {

        // function f() {
        //         echarts.util.each(countries, function (country) {
        //             var datasetId = 'dataset_' + country;
        //             datasetWithFilters.push({
        //                 id: datasetId,
        //                 fromDatasetId: 'dataset_raw',
        //                 transform: {
        //                     type: 'filter',
        //                     config: {
        //                         and: [
        //                             { dimension: 'Year', gte: 1950 },
        //                             { dimension: 'Country', '=': country }
        //                         ]
        //                     }
        //                 }
        //             });
        //             seriesList.push({
        //                 type: 'line',
        //                 datasetId: datasetId,
        //                 showSymbol: false,
        //                 name: country,
        //                 endLabel: {
        //                     show: true,
        //                     formatter: function (params: any) {
        //                         return params.value[3] + ': ' + params.value[0];
        //                     }
        //                 },
        //                 labelLayout: {
        //                     moveOverlap: 'shiftY'
        //                 },
        //                 emphasis: {
        //                     focus: 'series'
        //                 },
        //                 encode: {
        //                     x: 'Year',
        //                     y: 'Income',
        //                     label: ['Country', 'Income'],
        //                     itemName: 'Year',
        //                     tooltip: ['Income']
        //                 }
        //             });
        //         });
        // }
        //
        // f()
        // option = {
        //     animationDuration: 10000,
        //     dataset: [
        //         {
        //             id: 'dataset_raw',
        //             source: _rawData
        //         },
        //         ...datasetWithFilters
        //     ],
        //     title: {
        //         text: 'Income of Germany and France since 1950'
        //     },
        //     tooltip: {
        //         order: 'valueDesc',
        //         trigger: 'axis'
        //     },
        //     xAxis: {
        //         type: 'category',
        //         nameLocation: 'middle'
        //     },
        //     yAxis: {
        //         name: 'Income'
        //     },
        //     grid: {
        //         right: 140
        //     },
        //     series: seriesList
        // };

        console.log(this.option)
        return (
            <div>
                <ReactECharts
                    style={{width:'1900px',height:'1000px'}}
                    // echarts={echarts}
                    option={this.option} // required
                    // notMerge={true}         // optional
                    // lazyUpdate={true}       // optional
                    // theme="my_theme" // optional
                    // onChartReady={this.onChartReadyCallback} // optional
                    // onEvents={EventsDict}
                    // opts={}
                />
            </div>
        );
    }
}


