
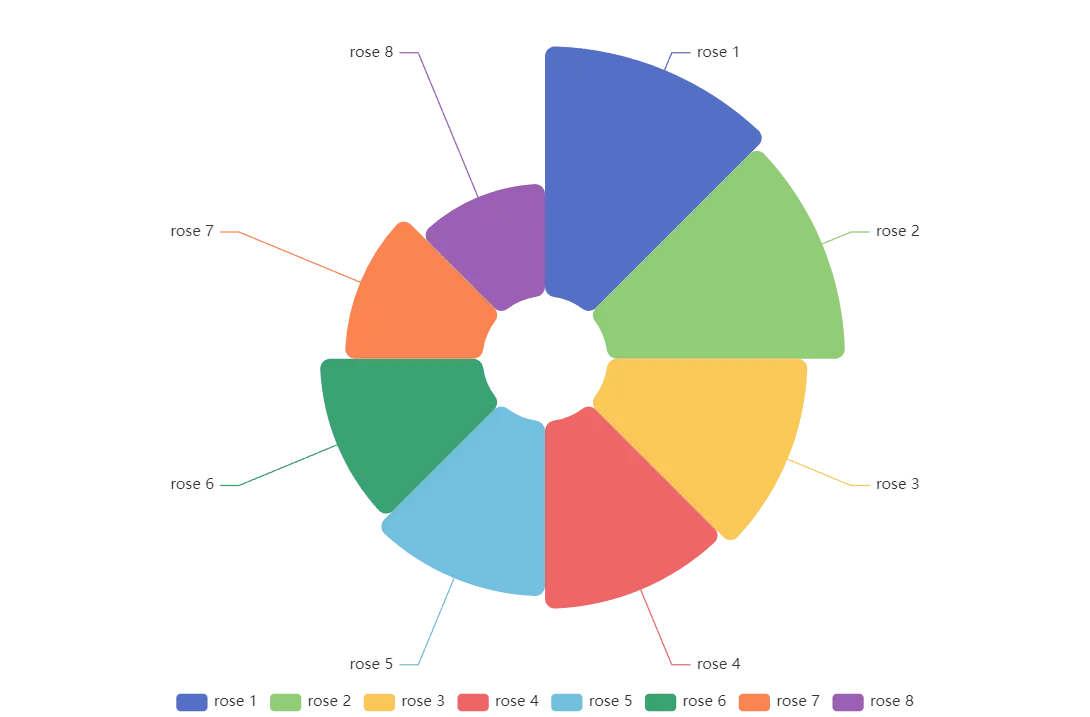
1 2 3 4 5 6 7 8 9 10 11 12 13 14 15 16 17 18 19 20 21 22 23 24 25 26 27 28 29 30 31 32 33 34 35 36 37 38 39 40 41 42 43 44 45 46 47 48 49 50 51 52 53 54 55 56 57 58 59 60 61 62 63 64 65 66 67 68 69 70 71 72 73 74 75 76 | import React, {Component} from 'react';import ReactECharts from 'echarts-for-react'; // or var ReactECharts = require('echarts-for-react');interface AppProps {}interface AppState {}export default class EChartApp extends Component<AppProps, AppState> { constructor(props:any) { super(props); this.state = { name: "Charts React" }; } option = { legend: { top: 'bottom' }, toolbox: { show: true, feature: { mark: { show: true }, dataView: { show: true, readOnly: false }, restore: { show: true }, saveAsImage: { show: true } } }, series: [ { name: 'Nightingale Chart', type: 'pie', radius: [50, 250], center: ['50%', '50%'], roseType: 'area', itemStyle: { borderRadius: 8 }, data: [ { value: 40, name: 'rose 1' }, { value: 38, name: 'rose 2' }, { value: 32, name: 'rose 3' }, { value: 30, name: 'rose 4' }, { value: 28, name: 'rose 5' }, { value: 26, name: 'rose 6' }, { value: 22, name: 'rose 7' }, { value: 18, name: 'rose 8' } ] } ] }; render() { console.log(this.option) return ( <div> <ReactECharts style={{width:'1900px',height:'1000px'}} // echarts={echarts} option={this.option} // required // notMerge={true} // optional // lazyUpdate={true} // optional // theme="my_theme" // optional // onChartReady={this.onChartReadyCallback} // optional // onEvents={EventsDict} // opts={} /> </div> ); }} |
Nightingale Chart
21
May