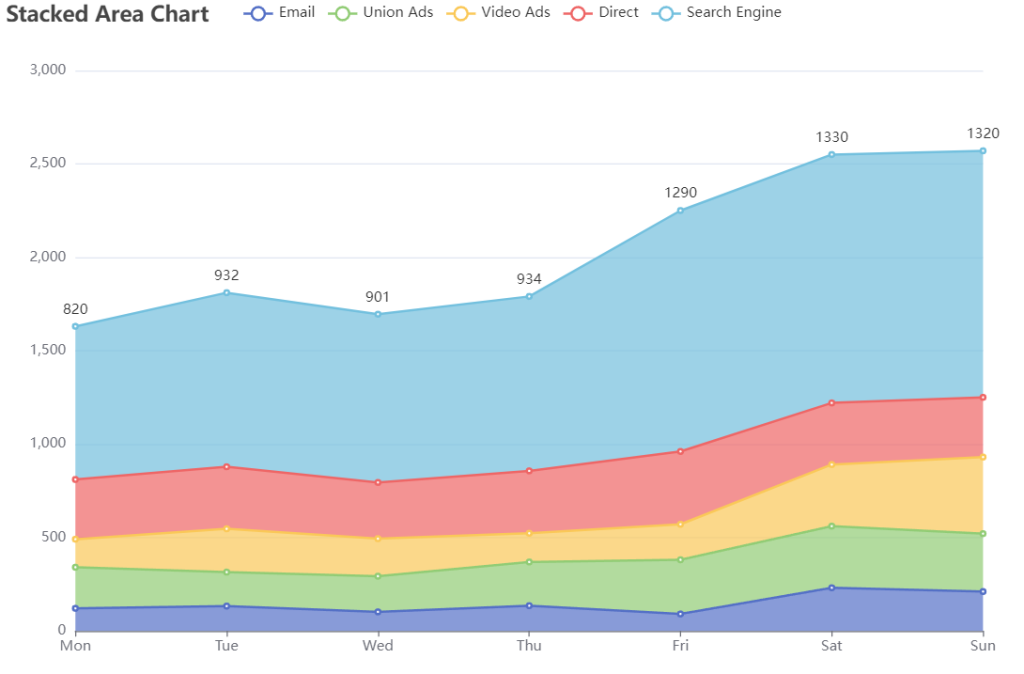
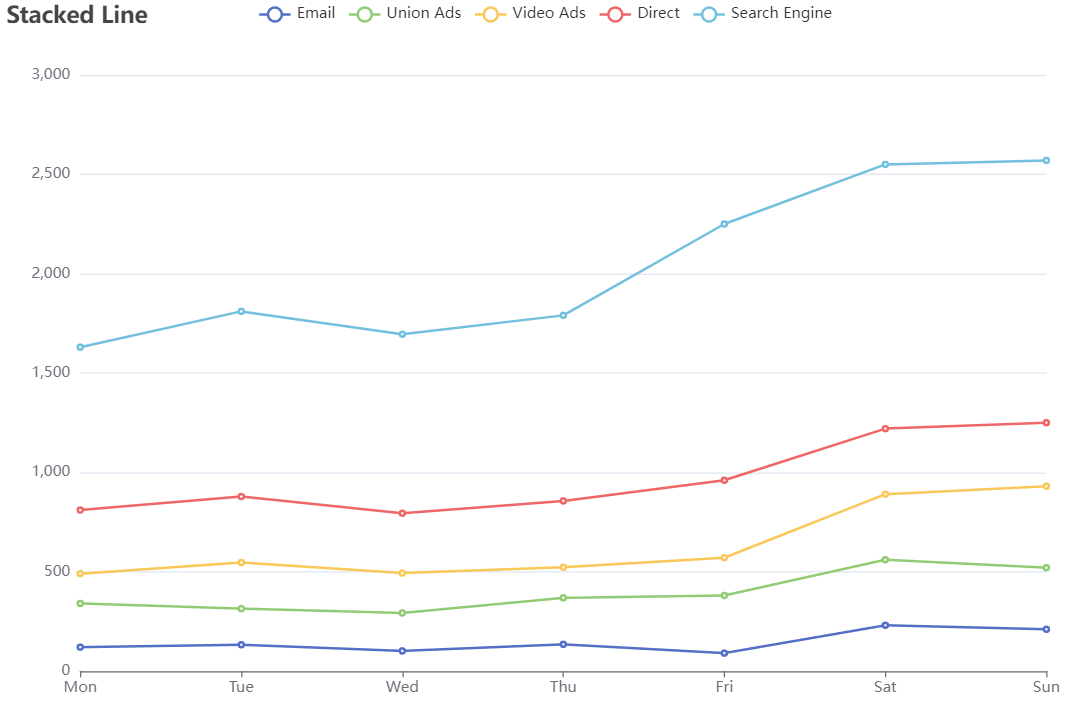
1 2 3 4 5 6 7 8 9 10 11 12 13 14 15 16 17 18 19 20 21 22 23 24 25 26 27 28 29 30 31 32 33 34 35 36 37 38 39 40 41 42 43 44 45 46 47 48 49 50 51 52 53 54 55 56 57 58 59 60 61 62 63 64 65 66 67 68 69 70 71 72 73 74 75 76 77 78 79 80 81 82 83 84 85 86 87 88 89 90 91 92 93 94 95 96 97 | import React, {Component} from 'react';import ReactECharts from 'echarts-for-react'; // or var ReactECharts = require('echarts-for-react');interface AppProps {}interface AppState {}export default class EChartApp extends Component<AppProps, AppState> { constructor(props:any) { super(props); this.state = { name: "Charts React" }; } option = { title: { text: 'Stacked Line' }, tooltip: { trigger: 'axis' }, legend: { data: ['Email', 'Union Ads', 'Video Ads', 'Direct', 'Search Engine'] }, grid: { left: '3%', right: '4%', bottom: '3%', containLabel: true }, toolbox: { feature: { saveAsImage: {} } }, xAxis: { type: 'category', boundaryGap: false, data: ['Mon', 'Tue', 'Wed', 'Thu', 'Fri', 'Sat', 'Sun'] }, yAxis: { type: 'value' }, series: [ { name: 'Email', type: 'line', stack: 'Total', data: [120, 132, 101, 134, 90, 230, 210] }, { name: 'Union Ads', type: 'line', stack: 'Total', data: [220, 182, 191, 234, 290, 330, 310] }, { name: 'Video Ads', type: 'line', stack: 'Total', data: [150, 232, 201, 154, 190, 330, 410] }, { name: 'Direct', type: 'line', stack: 'Total', data: [320, 332, 301, 334, 390, 330, 320] }, { name: 'Search Engine', type: 'line', stack: 'Total', data: [820, 932, 901, 934, 1290, 1330, 1320] } ] }; render() { console.log(this.option) return ( <div> <ReactECharts style={{width:'1900px',height:'1000px'}} // echarts={echarts} option={this.option} // required // notMerge={true} // optional // lazyUpdate={true} // optional // theme="my_theme" // optional // onChartReady={this.onChartReadyCallback} // optional // onEvents={EventsDict} // opts={} /> </div> ); }} |