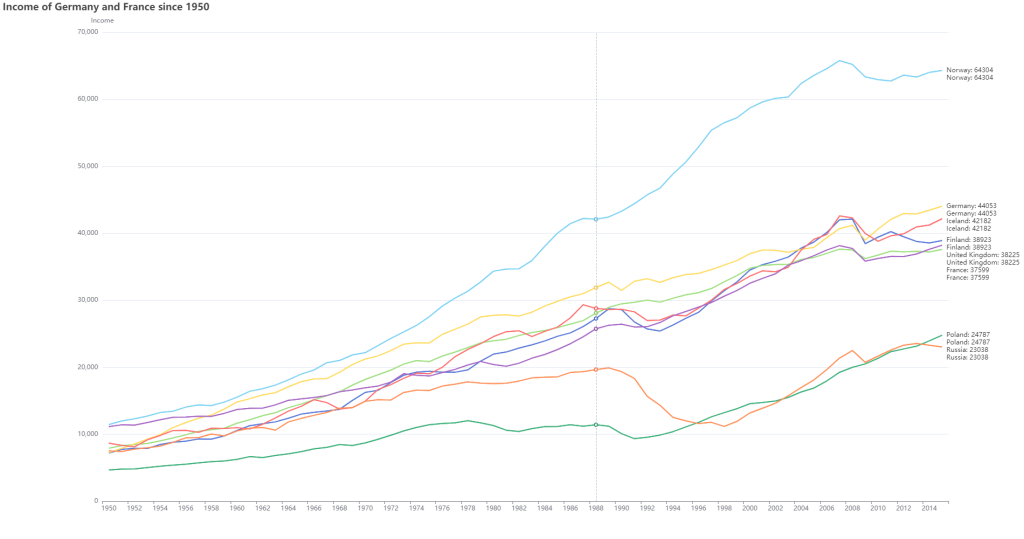
import React, {Component} from 'react';
import ReactECharts from 'echarts-for-react';  // or var ReactECharts = require('echarts-for-react');


interface AppProps {}
interface AppState {}


export default class EChartApp extends Component<AppProps, AppState> {

    constructor(props:any) {
        super(props);
        this.state = {
            name: "Charts React"
        };
    }
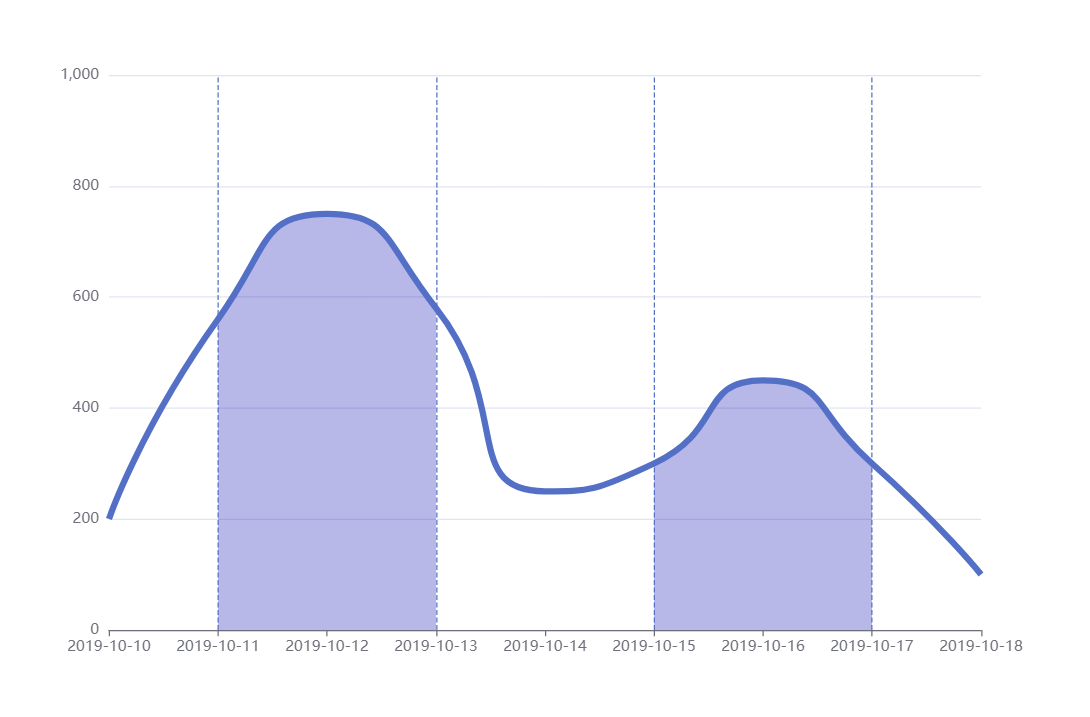
    option = {
        xAxis: {
            type: 'category',
            boundaryGap: false
        },
        yAxis: {
            type: 'value',
            boundaryGap: [0, '30%']
        },
        visualMap: {
            type: 'piecewise',
            show: false,
            dimension: 0,
            seriesIndex: 0,
            pieces: [
                {
                    gt: 1,
                    lt: 3,
                    color: 'rgba(0, 0, 180, 0.4)'
                },
                {
                    gt: 5,
                    lt: 7,
                    color: 'rgba(0, 0, 180, 0.4)'
                }
            ]
        },
        series: [
            {
                type: 'line',
                smooth: 0.6,
                symbol: 'none',
                lineStyle: {
                    color: '#5470C6',
                    width: 5
                },
                markLine: {
                    symbol: ['none', 'none'],
                    label: { show: false },
                    data: [{ xAxis: 1 }, { xAxis: 3 }, { xAxis: 5 }, { xAxis: 7 }]
                },
                areaStyle: {},
                data: [
                    ['2019-10-10', 200],
                    ['2019-10-11', 560],
                    ['2019-10-12', 750],
                    ['2019-10-13', 580],
                    ['2019-10-14', 250],
                    ['2019-10-15', 300],
                    ['2019-10-16', 450],
                    ['2019-10-17', 300],
                    ['2019-10-18', 100]
                ]
            }
        ]
    };


    render() {


        console.log(this.option)
        return (
            <div>
                <ReactECharts
                    style={{width:'1900px',height:'1000px'}}
                    // echarts={echarts}
                    option={this.option} // required
                    // notMerge={true}         // optional
                    // lazyUpdate={true}       // optional
                    // theme="my_theme" // optional
                    // onChartReady={this.onChartReadyCallback} // optional
                    // onEvents={EventsDict}
                    // opts={}
                />
            </div>
        );
    }
}


