import React, {Component} from 'react';
import ReactECharts from 'echarts-for-react';  // or var ReactECharts = require('echarts-for-react');


interface AppProps {}
interface AppState {}


export default class EChartApp extends Component<AppProps, AppState> {

    constructor(props:any) {
        super(props);
        this.state = {
            name: "Charts React"
        };
    }

    option = {
        title: {
            text: 'Accumulated Waterfall Chart'
        },
        tooltip: {
            trigger: 'axis',
            axisPointer: {
                type: 'shadow'
            },
            formatter: function (params: any) {
                let tar;
                if (params[1] && params[1].value !== '-') {
                    tar = params[1];
                } else {
                    tar = params[2];
                }
                return tar && tar.name + '<br/>' + tar.seriesName + ' : ' + tar.value;
            }
        },
        legend: {
            data: ['Expenses', 'Income']
        },
        grid: {
            left: '3%',
            right: '4%',
            bottom: '3%',
            containLabel: true
        },
        xAxis: {
            type: 'category',
            data: (function () {
                let list = [];
                for (let i = 1; i <= 11; i++) {
                    list.push('Nov ' + i);
                }
                return list;
            })()
        },
        yAxis: {
            type: 'value'
        },
        series: [
            {
                name: 'Placeholder',
                type: 'bar',
                stack: 'Total',
                silent: true,
                itemStyle: {
                    borderColor: 'transparent',
                    color: 'transparent'
                },
                emphasis: {
                    itemStyle: {
                        borderColor: 'transparent',
                        color: 'transparent'
                    }
                },
                data: [0, 900, 1245, 1530, 1376, 1376, 1511, 1689, 1856, 1495, 1292]
            },
            {
                name: 'Income',
                type: 'bar',
                stack: 'Total',
                label: {
                    show: true,
                    position: 'top'
                },
                data: [900, 345, 393, '-', '-', 135, 178, 286, '-', '-', '-']
            },
            {
                name: 'Expenses',
                type: 'bar',
                stack: 'Total',
                label: {
                    show: true,
                    position: 'bottom'
                },
                data: ['-', '-', '-', 108, 154, '-', '-', '-', 119, 361, 203]
            }
        ]
    };


    render() {

        console.log(this.option)
        return (
            <div>
                <ReactECharts
                    style={{width:'1900px',height:'1000px'}}
                    // echarts={echarts}
                    option={this.option} // required
                    // notMerge={true}         // optional
                    // lazyUpdate={true}       // optional
                    // theme="my_theme" // optional
                    // onChartReady={this.onChartReadyCallback} // optional
                    // onEvents={EventsDict}
                    // opts={}
                />
            </div>
        );
    }
}
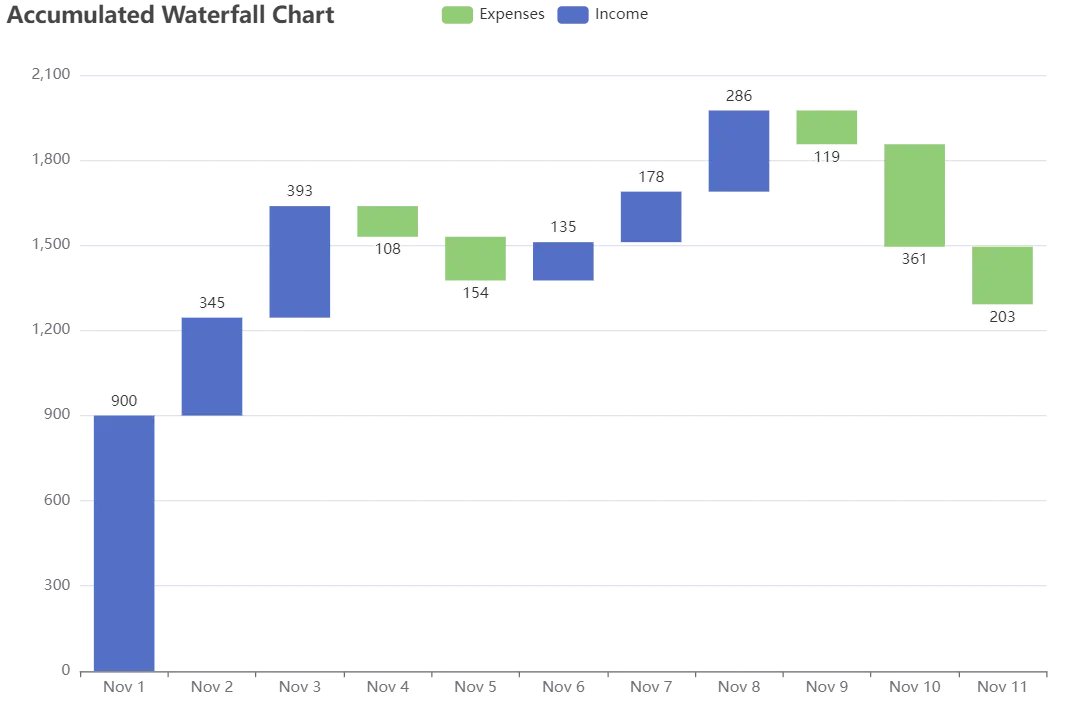
Accumulated bar-waterfall
19
May

